
A Picture is Worth How Much???
A picture is worth a thousand words….right?
That’s my Dad and me on a recent trip to Myrtle Beach, riding the Skywheel…a monster Ferris wheel, the 2nd tallest in North America when it opened in 2011. You’d think we were both in the process of coming unglued, experiencing sheer terror while being propelled up and over the sands of Myrtle Beach and its boardwalk. But…thankfully this picture is misleading. Anyone who’s been around the 2 of us “Blair Boys,” as we’ve so affectionately been dubbed, knows we love a good prank and we’re always looking for whatever levity can be found in the moment.
The unwitting recipient of this prank? My partner, Susan, who freaked out at the last minute when she saw upon arrival how the wheel soared ominously overhead. When back on the ground, and with straight faces, we told Susan that my mother had snapped a pic of us at just the right moment…a moment where we ever so briefly lost our bravery. We confessed that we wanted to deny being even mildly afraid…but the picture made it impossible…and sorta gave us away. We then showed her the picture.
Dad and I were put on KP duty the rest of that vacation…
So, yes, a picture can be misleading…sometimes unintentionally, sometimes not so unintentionally. In the world of infrared photography, and what defects it can detect in your home…a picture can often NOT be worth a thousand words. A picture made from an infrared camera is called a “thermogram.” If used with a thorough understanding of building science, as well as being trained to interpret what is in the thermogram, that thermal camera can be an extremely powerful tool. If used by someone without the proper training, it can at least be a tool of misleading information borne simply out of ignorance…and worst, a tool for deliberate deception. This is often the case with any gadget offering advanced technology…they can come off as having magical powers…unfathomable abilities. A quick google search for “infrared and ghosts” will introduce you to a popular example of this. It is believed by many in the paranormal CSI world that IR cameras can detect ghosts. This is simply due to the way the infrared spectrum of light behaves differently around different materials…some will absorb, some reflect, some emit back quickly, others slowly. The heat from our body gets absorbed by most materials inside our home…but reflects off of glass and most metals. What these CSI ghosts hunters are actually seeing is the reflected heat of their own bodies…passionately stimulated by the lure of finding that spooky ghost!
In an effort to make this blog entry user friendly, and actually helpful, I’ll stay away from some of the mind-numbing geeky science involved with our discussion and focus on a handful of the most common errors of misinterpretation of thermograms used in the assessment of building structures. I’m pulling from my own professional experience as a thermographer in the field of residential energy efficiency testing, troubleshooting, and weatherization. My hope is that if you’ve been handed a home inspection with any use of thermography that you’ll be a better informed consumer of this service, and less likely to be scared by misinformation. (Caveat…not all thermograms in home inspections are misleading…even the ones that are a sincere attempt to point out what is thought a defect.)
Wood be a problem….
It “would” be a problem, if the insulation in our walls and ceilings were the same as wood. Thankfully, fiberglass, cellulose, or foam insulation is a much better insulator than wood. If it wasn’t, we’d all live in skinny log homes. (Thick logs provide what’s called the “thermal mass effect”…its own & efficient kind of protection against the elements in the right climate). But since the relatively thin wood framing in our homes insulates less than properly installed insulation in-between…it usually looks different in a thermogram. If there’s enough temperature difference between inside and outside of the home…the insulation will resist heat transfer much better than the wood. Therefore we will see this difference with a thermal imager…which is merely detecting the difference in the surface temperature along the wall…it’s not seeing “into” the wall.
The paragraph above has the clues we need about how a thermogram can be misleading and misinterpreted.
Wood framing in conventional framed homes resists heat less than properly installed insulation.
More wood, side by side, equals even less thermal resistance in that area…than if a single piece of wood were used.
If there’s not enough difference between indoor and outdoor temperatures, you will barely see any differences in the framed/insulated wall…if the wall is not resisting heat transfer from one side to the other…we’ve lost our special powers.
If there’s NO differences between indoor and outdoor temperatures, then leave the camera at home.
If the insulation is not properly installed (no compression, gaps, or voids) then we’ve got some real issues of differential diagnosis to deal with.
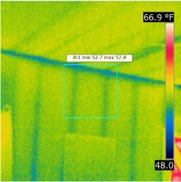
What we see above are good examples of a normal, and properly insulated wall. The yellow colors indicate the warmer surface of the insulated bays between the studs, and the green/blue lines are the studs that are passing the indoor heat more quickly through the wall…therefore a bit cooler. Now…notice the darker blue line going horizontally in the left picture? Uh oh….do we have a defect of insulation somehow occurring along the top of the wall? Or in the picture at right, do we have a strip of insulation missing going vertically? No, and no. These are all examples of what’s called “thermal bridging” that wood passes heat faster than insulation, and that more wood next to each other passes even more heat. The horizontal and vertical dark blue lines show the double stacked 2×4 at the top of the wall, and the vertical shows the typically framed corner which uses more studs than the rest of the wall. Most folks using a thermal camera for a building inspection would not make this very basic error, but I’ve seen it done more than once. Can you imagine ripping out the drywall only to find wood where you thought there was an insulation defect?
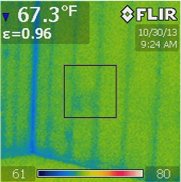
Most defects of insulation….that would actually make a real difference in the comfort and/or energy bills for your home are pretty obvious in a thermogram. Look at the example below. These homeowners were complaining of comfort issues in their bedroom. For some reason it was harder to keep at the same temperature as the rest of the house. After screening the non problematic areas of ceiling, and getting its baseline temperature, I locked in the temperature range of the camera…so it did not automatically adjust the range for different conditions. That way I could compare apples to apples…ceiling to ceiling temps rather than each ceiling being simply relative to its adjacent wall temperatures. If there was a ceiling in the house that had any temperature difference from the others…I’d be able to see it clearly. As I walked down the hall, and turned the corner into the master bedroom, my camera turned bright blue, indicating a colder surface than the other ceilings. This whole master bedroom ceiling was not insulated! Is it not obvious, in the thermogram below, that we have a problem? If your inspector includes a picture like this, then you have a problem…even if you don’t live in Houston.
Aside from this dramatic example of missing insulation, a more common thermogram on an inspection report are minor areas of different colors that may simply indicate a section of insulation is compressed (therefore has less pockets of air that provide the heat resistance), gaps of insulation, variations of thermal bridging, wiring and plumbing interruptions within the insulation, etc. This is where building science is needed…to understand what may be going on. If an inspector has raised the concern that a thermogram indicates a defect of insulation it should be evaluated further to determine the nature of the apparent problem, and whether it would actually be a cost effective thing to fix. If you’re already living in your home, and want to button things up, stick to the obvious areas, or ones that are giving comfort problems.
Convection is great…in an oven…or with big fans that sit in doorways…
Don't you love a convection oven? Faster, more evenly cooked turkey on Thanksgiving is what immediately comes to my mind. When that convection oven’s fan whirls the air around inside…the moving hot air transfers more heat all around whatever you’re cooking. Moving air transfers more heat than still air.
What does this have to do with our homes? Besides enjoying a great turkey, it simply means that air movement in and out of our homes also affects the energy bills and comfort we feel inside them. Perhaps the most common complaints are cold drafts…
A thermal camera can actually see convection…or moving air under the right conditions. To be more precise, what it sees is simply the “effect” the moving air has on the surface it’s blowing across. The moving air will bring the adjacent surface temperature closer to its own temperature. Remember, a thermal camera only sees temperature differences along a surface…so if the moving air is the same temperature as the surface, we won’t see any difference. But have the cold outside air blow across an interior surface and voila….we have a really wispy thermogram!
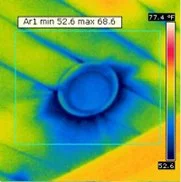
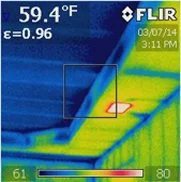
Here is a picture of an all too common defect inside our homes…the dreaded can light! Major punctures through our homes thermal boundary. But if you’re an owner of a new home, most likely this inherent “defect” in the thermal boundary has been minimized. Newer ICAT units (insulation contact, air tight) allow the insulation to be placed in direct contact with them, and are theoretically air tight. Theoretical because the unit itself is tight, but it all comes down to proper installation and sealing of the big hole in the drywall that’s holding the unit. Energy Star requires these open joints around can lights to be sealed…because if they’re adjacent to attic space they are a direct avenue for air movement in and out of the attic and into your home. Who wants air exchange from 4,8 or 10 holes in the ceiling between the attic and living space? Kind of inspires visions of “beam me up Scotty.” Imagine a sudden gust of wind lowering the pressure inside your home relative to outside, and some creature from the attic being teleported into your living room! Or worse, some freak occurrence of nature that dramatically raised the pressure inside and grandma got beamed up into the attic!
Although most inspectors using an infrared camera know that can lights are notorious for air leakage, fewer know about the difference between heat transfer through solid surfaces (conduction), through air movement (convection), and that different materials emit their absorbed heat differently (radiation). In the thermogram above we have a good example of convective heat transfer…the wispy feathery pattern that is diagnostic of air movement. This is a simple problem to fix….caulk the perimeter of the can to the drywall. If the wispy lines weren’t there we’d most likely see just a light blue ring around the can light. Uh oh…more problems?! Still air leakage? No…this is where the thermal camera in untrained hands can be problematic. Most of the time, that ring around the can light is some type of metal, and if it’s metal it will show up differently in the thermogram. “But it’s blue so it must be a problem,” is the thinking of an untrained eye.
There’s a lot of different blues in this thermogram…but only some are of concern. The light blue ring…simply indicates that the metal emits radiation energy much less than the wood around it. We’re creeping ever so closely to mind-numbing nerdy science here…but the name of this in case you hear it somewhere is “emissivity.” If you’ve heard of Low-E windows….E is for emissivity. The lower the emissivity of a material, the less heat energy it radiates…so it shows up differently in the thermogram. Whenever there’s an obvious and distinct difference of colors in a thermogram, you have to rule out the effects of emissivity differences. You may wonder about those blue streaks? Air leakage through the T&G ceiling? Most likely no…although I have seen occasions of this. In this thermogram I would say the slightly lower temperature in the groove is simply the difference of thickness in the wood. If there was convection…once again we would see wispy features.
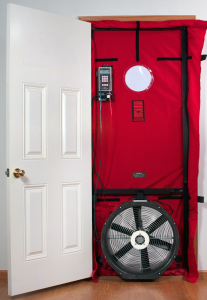
So what about convection of big fans in doorways? With the aid of a contraption generally known as a blower door, your home’s interior pressure can be lowered…relative to outdoors. A blower door is simply a frame that fits in your exterior door opening, covered with some type of plastic canvas, and has a big fan in it. To properly detect air leakage with an infrared camera…you gotta use a blower door. A red flag should go up if you read a thermal inspection report where air leakage is cited as a problem…and you know they didn’t use a blower door. Since the blower door lowers the pressure inside your home, relative to outside, any sources of air leakage in the thermal boundary of your home will start sucking in air to balance the air pressure. And as long as that outside air is different enough temperature wise than inside air…the thermal camera will see the fingerprints of convection. This artificially produced convection with the blower door & thermal camera, is one of the standard protocols, and most often used, for the detection of air infiltration into a building structure.
So is a picture worth a thousand words? I’ll appeal to how my grandfather responded to my question about whether he wore briefs or jocky shorts. Without batting an eye he said, “depends.”
Yes indeed….well said grandpa. However, being navigationally challenged, a picture is worth more than a thousand words to me. I’ve gotta see a picture…because someone verbally reciting directions puts me into a trance. Thank God for GPS….